使用Matrix-eQTL完成cis-eQTL定位
表达数量性状位点(eQTL)
基因组上有些区域能导致某些基因的表达(mRNA)产生明显的变化,这些位置或者区域被称为表达数量性状位点(eQTL),一般认为离目标基因1Mb位置以内的为顺式位点(local-eQTLs , cis-eQTLs),与目标基因位置超过1Mb的成为反式位点(distant-eQTLs , trans-eQTLs),主要通过线性回归对兴趣位点与目标基因表达量进行回归,并检验关系是否显著。
使用Matrix eQTL进行大规模eQTL定位
本文只进行cis-eQTL和trans-eQTL定位,以下是本人真实研究数据在此进行举例并为自己提供笔记
数据准备
进行cis-eQTL和trans-eQTL定位需要准备以下数据
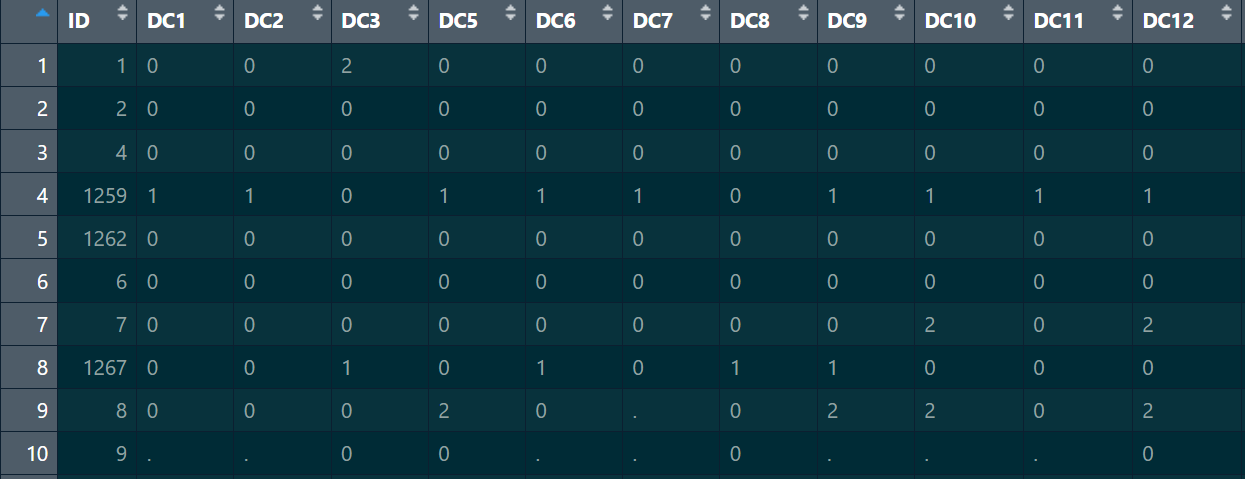
- snp_genotype_matrix(基因分型矩阵,行为snp id,列为每个样本)(本例子中使用sv)
- snpid必须与下面的snp_loc中的id一样,并且sample_name的顺序必须和下面的expression_matrix中的sample_name顺序一致。
- 并且matrix指的是R语言中的matrix,所以第一列就直接是值了,snpid应该设置为rowname。
| snpid | sample_name-1 | sample_name-2 | sample_name-3 | …… |
|---|---|---|---|---|
| 1 | 0(基因型) | 1(基因型) | 2(基因型) | …… |
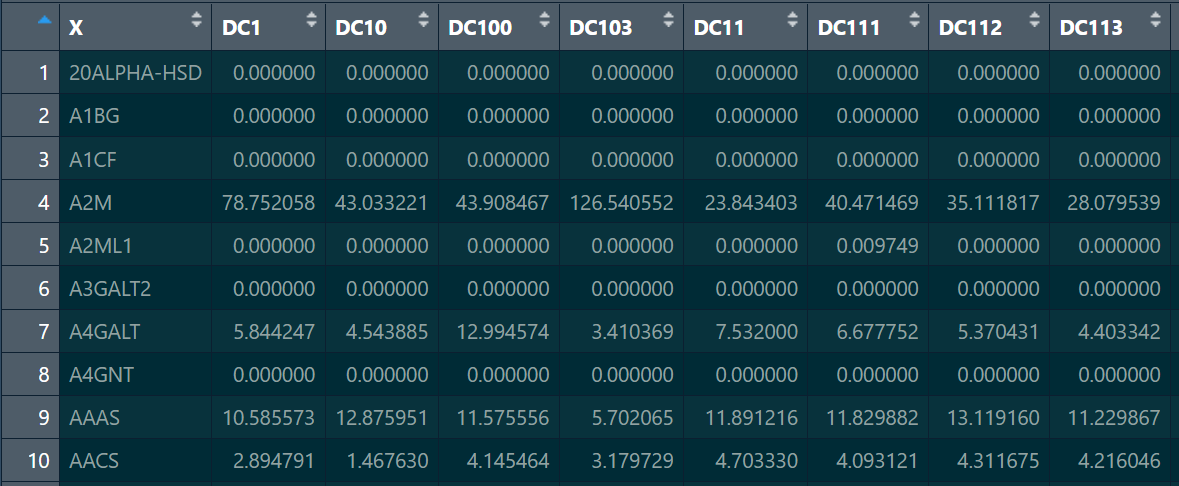
- expression_matrix(表达量矩阵,行为基因名或者基因ID,只要与下面的gene_pos中的一致即可,列为每个样本)
- 注意表达量必须为数值类型的
- 基因名字必须与下面的gene_pos中的基因名一致
- 基因名字作为matrix的rowname
| gene_id | sample_name-1 | sample_name-2 | sample_name-3 | …… |
|---|---|---|---|---|
| gene_id | 该基因在该样本的表达量 | 同左 | 同左 | …… |
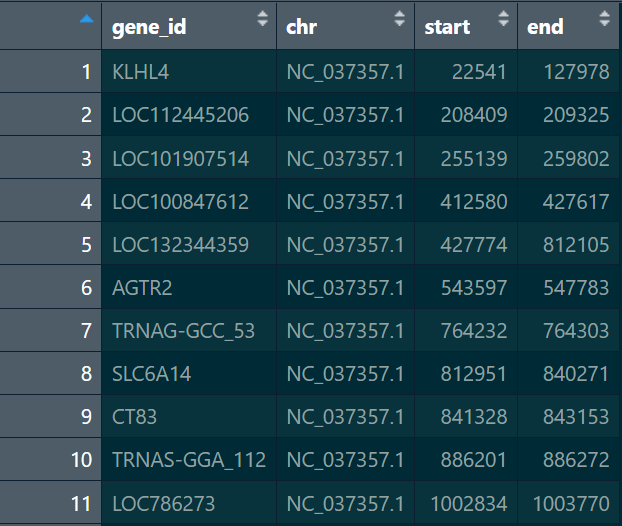
- gene_pos(基因相关信息)
该文件应该以data.frame形式存入R对象中,并且列名应该严格按照下面的示例
| geneid | chr | left | right |
|---|---|---|---|
| 基因ID | 染色体号 | 基因起点 | 基因终点 |
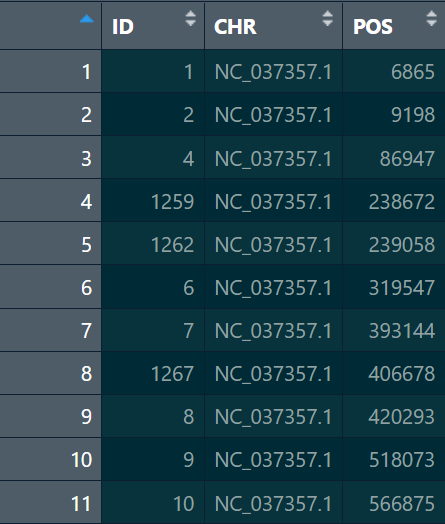
- snp_loc (变异位点信息)
同上,本内容也应在R中使用data.frame对象存放,列名如下
| snpid | chr | pos |
|---|---|---|
| 变异ID | 染色体号 | 变异位置 |
Matrix eQTL api简介
matrix eQTL使用R编写,以快速进行大规模eQTL定位为人熟知,下面是本例要用的api以及主要参数解释
# 本例子中主要使用Matrix_eQTL_main function
# 其主要参数及解释如下

Matrix_eQTL_main(
        snps, # 基因型矩阵,需要SliceData对象,要求见数据准备部分,SliceData稍后介绍
        gene, # 表达量矩阵,需要SliceData对象
        cvrt = SlicedData$new(), # 协变量,默认为空
        output_file_name = "", # 默认输出文件
        pvOutputThreshold = 1e-5, # 显著阈值,默认值10^(-5)
        useModel = modelLINEAR, # 模型选择,默认线性模型,还有两种其他模型,见Matrix eQTL文档
        errorCovariance = numeric(),
        verbose = TRUE, # 过程日志输出
        output_file_name.cis = "", # cis-eQTL显著关联结果的输出文件
        pvOutputThreshold.cis = 0, # cis-eQTL的显著值阈值
        snpspos = NULL, # data.frame,cis-eQTL和trans-eQTL需要,因为需要提供snp的位置
        genepos = NULL, # data.frame,同理在进行cis-eQTl和trans-eQTL时需要
        cisDist = 1e6, # cis-eQTL的距离,默认为1Mb范围内
        pvalue.hist = FALSE
        min.pv.by.genesnp = FALSE,
        noFDRsaveMemory = FALSE)

# 注意如果不指定pvOutputThreshold.cis,snpspos,genepos将不会进行cis-eQTL和trans-eQTL分析,将会对所有候选位点和候选基因进行关联分析

# 当 pvOutputThreshold=0, pvOutputThreshold.cis>0时将只进行cis-eQTL分析
# 当 pvOutputThreshold>0,pvOutputThreshold.cis>0时将进行cis-eQTL和trans-eQTl,其中trans-eQTL显著值使用pvOutputThreshold


# 注意,前面在数据准备过程中,snp_genotype_matrix,expression_matrix被存成R矩阵,但是上面api要求输入SliceData对象
# 所以需要转换成SliceData对象,SliceData类是Matrix eQTL中的一个用于矩阵的类,具体可以其帮助中查看
具体实施过程
数据示例
gene_expression:读取进来的时候使用data.frame存储,后面要进行处理
genotype:同上,以data.frame存储,后续要进行处理
snp_pos:这个读取进来用data.frame存储即可,但是列名需要更换,第一列的ID应该与genotype中的ID一致
gene_pos:读取进来直接使用data.frame存储,gene_id列应与gene_exp中行名保持一致
# 读取需要的文件
# 基因位置
gene_pos<-read.csv('path_to/gene_pos.csv',header = TRUE)
# 候选变异的位置信息
sv_loc<-read.csv('path_to/sv_loc.csv',header = TRUE)
genotype<-read.csv('path_to/genotype.csv',header = TRUE)
gene_expression<-read.csv('path_to/expression_tpm.csv',header = TRUE)


# 过滤基因表达量低的基因,每个基因在所有的样本中有sample_percentage百分比的样本的表达量高于threshold才保留,并进行log转换
filter_low_expression_genes <- function(expr_matrix, threshold = 1, sample_percentage = 0.3) {
  gene_names<-expr_matrix[,1]
  expr_values <- as.data.frame(lapply(expr_matrix[, -1], as.numeric))
  # 计算超过阈值的样本数量阈值
  sample_threshold <- ceiling(ncol(expr_values) * sample_percentage)
  # 对每个基因,计算在样本中TPM>=1的样本数
  filtered_matrix <- expr_matrix[rowSums(expr_values >= threshold) >= sample_threshold, ]
  # 对过滤后的表达矩阵进行 log2 转换 (log2(TPM + 1))
  log_transformed_matrix <- log2(filtered_matrix[,-1] + 1)
  log_transformed_matrix <- cbind(Gene = gene_names[rowSums(expr_values >= threshold) >= sample_threshold], log_transformed_matrix)
  return(log_transformed_matrix)
}


# 检查基因位置和表达矩阵中基因的交集并返回
# param: 表达矩阵,基因信息
check_the_cross<-function(gene_exp,gene_pos){
  if(is.null(gene_exp)){
    print("表达矩阵不存在")
    return(-1)
  }
  else if(is.null(gene_pos)){
    print("基因信息不存在")
    return(-1)
  }
  else{
    library(dplyr)
    result<-filter_low_expression_genes(gene_exp)
    result<- result %>%
      filter(result[[1]] %in% gene_pos[[1]])
    # 处理表达量数据,去除表达量小的基因
    return(result)
  }
}

# 只保留兴趣基因的的表达量
gene_expression_cross<-check_the_cross(gene_expression,gene_pos)
new_genotype<-genotype
# 将genotype中的缺失值替换成NA
new_genotype[new_genotype == "."]<-NA

# 获取表达矩阵和基因型矩阵中样本的交集(有些样本没有表达数据,有些样本没有基因型数据)
common_names<-intersect(names(gene_expression_cross),names(new_genotype))
gene_expression_cross<-gene_expression_cross[,c('Gene',common_names)]
new_genotype<-new_genotype[,c('ID',common_names)]

# 按列名排序,确保两个data.frame列名序一样,这很重要
gene_expression_cross <- gene_expression_cross[, c('Gene',names(gene_expression_cross)[-1][order(names(gene_expression_cross)[-1])])]
new_genotype<-new_genotype[,c('ID',names(new_genotype)[-1][order(names(new_genotype)[-1])])]


# 由于matrix_eqtl需要特定类型的数据,所以将data.frame去掉列名,首列后,转换成matrix
# 取出第一列作为后续矩阵的行名
row_name<-gene_expression_cross$Gene
# 去除第一列
gene_exp_matrix<-gene_expression_cross[,-1]
# 列名置空
colnames(gene_exp_matrix)<-NULL
# 转换为矩阵
gene_exp_matrix<-as.matrix(gene_exp_matrix)
# 再给矩阵指定rowname
row.names(gene_exp_matrix)<-row_name

# 同样操作
row_name_genotype<-new_genotype$ID
genotype_matrix<-new_genotype[,-1]
colnames(genotype_matrix)<-NULL
genotype_matrix<-as.matrix(genotype_matrix)

# 将矩阵的值转换为数值
genotype_matrix <- matrix(as.numeric(genotype_matrix), nrow = nrow(genotype_matrix), ncol = ncol(genotype_matrix))
rownames(genotype_matrix)<-row_name_genotype

# 使得两data.frame列名满足输入要求
colnames(sv_loc)<-c('snpid','chr','pos')
colnames(gene_pos)<-c('geneid','chr','left','right')

# 确保gene_pos中的基因和表达矩阵中的基因一致(因为前面对表达矩阵进行了过滤,有些基因被滤除)
gene_pos<-gene_pos %>%
  filter(gene_pos$geneid %in% gene_expression_cross$Gene)

# eqtl相关参数
cis_threshold <- 1e-5
trans_threshold <- 1e-5
cis_dist <- 1e6

pvOutputThreshold_cis = cis_threshold;
pvOutputThreshold_tra = trans_threshold;

cisDist = cis_dist

library(MatrixEQTL)

me<-Matrix_eQTL_main(
  snps = SlicedData(genotype_matrix), # 因为SliceData可以使用矩阵直接构造对象,所以前面转换成矩阵后直接构造SliceData对象
  gene = SlicedData(gene_exp_matrix), # 同上
  pvOutputThreshold = pvOutputThreshold_tra,
  pvOutputThreshold.cis = pvOutputThreshold_cis,
  useModel = modelLINEAR,
  errorCovariance = numeric(),
  verbose = TRUE,
  snpspos = sv_loc,
  genepos = gene_pos,
  cisDist = cisDist,
  output_file_name = "trans_eqtls.txt"
  output_file_name.cis = "cis_eqtls.txt",
  pvalue.hist = "qqplot",
  min.pv.by.genesnp = FALSE,
  noFDRsaveMemory = FALSE
)
结果解读
上述定位完成后结果将存放在me对象中,该对象结构如下
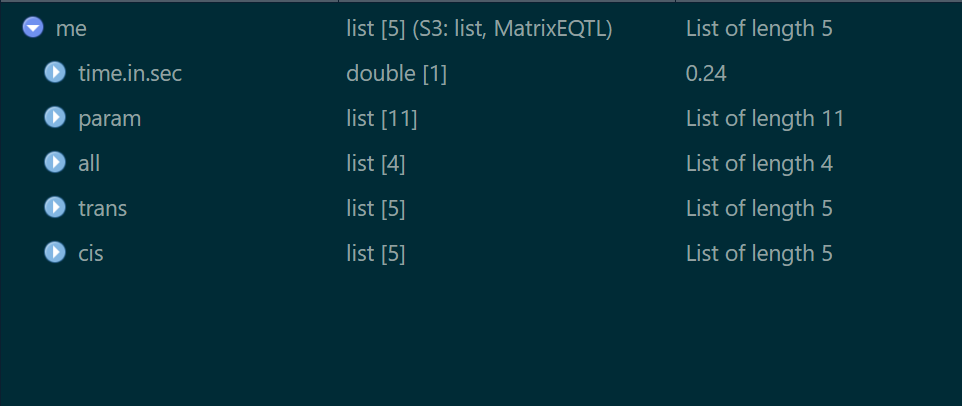
其中trans与cis分别存放两种类型的eQTL位点,接下来我们挑选出FDR<=0.05并且最显著的一个cis-eQTL 这里挑选出来,snp_id=68,gene_id=”LONRF3”的一组关联,我们将LONRF3的表达量列出,并且将其对应的snp genotype列出,对其做线性拟合,然后绘制箱线图展示关系
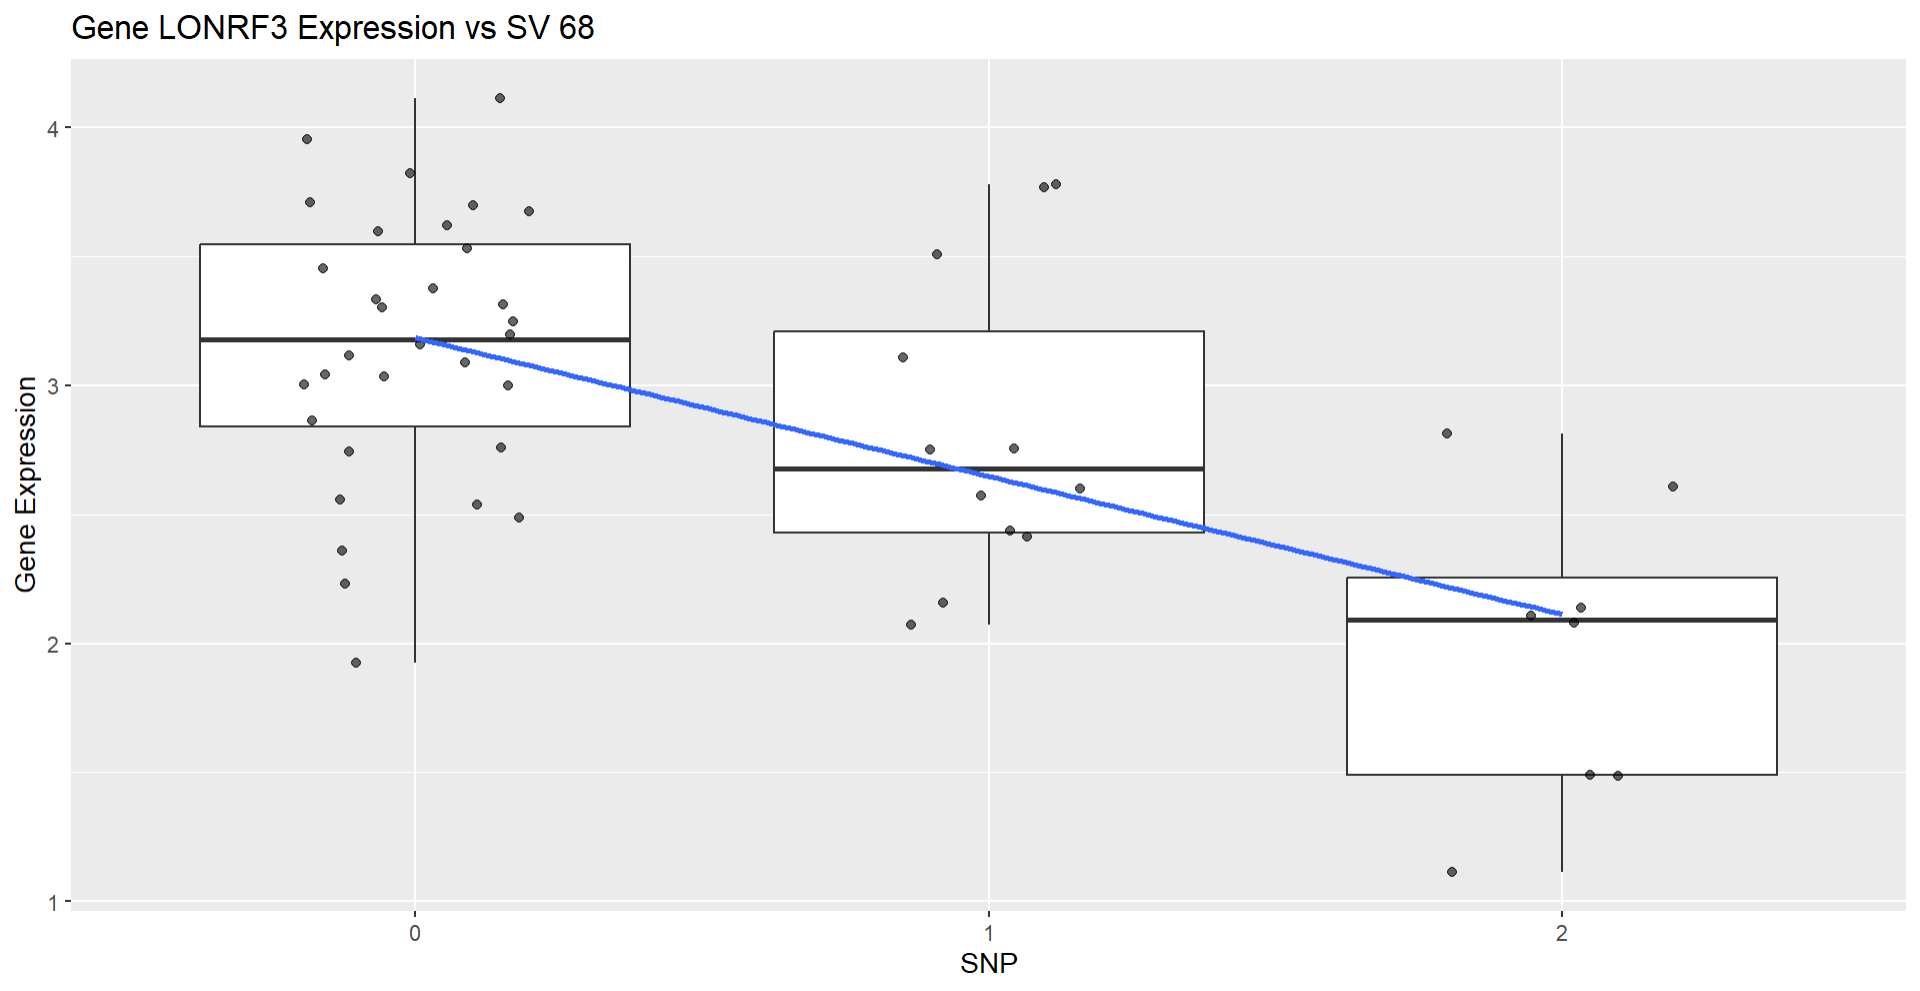
从图中可以看出基因型的不同确实导致了表达量的变化,可能这个变异以某种机制作用于该基因的表达,具体还得后续分析。
End
本文章仅记录自己使用Matrix-eQTL进行eQTL定位的过程,如有问题或者误导可联系我交流。